
Dynamic Pricing
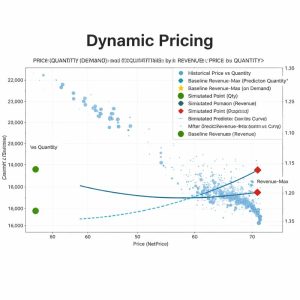
This chart illustrates how Dynamic Pricing balances price, demand, and revenue bysimulating optimal price points that maximize revenue under changing marketconditions.
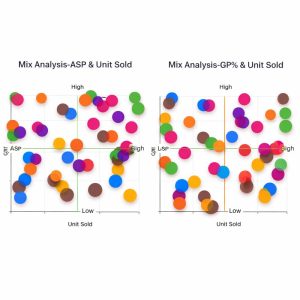
Pocket Price vs Volume
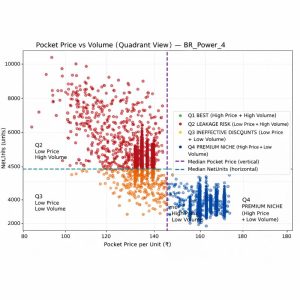
The chart segments products by price–volume performance to identify marginleakage, discount inefficiencies, and premium opportunities.
FG RM Inventory
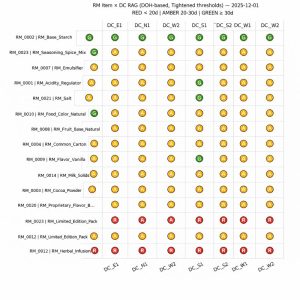
This RAG heatmap highlights raw materials at stock-out risk across distributioncenters based on days-of-holding, enabling proactive replenishment and riskmitigation.
FG and RM Goods
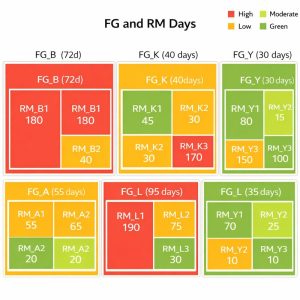
This treemap shows Finished Goods inventory days alongside their underlying RawMaterial exposure, making it easy to identify FG risks driven by specific RMoverstock or shortages.
GTN use case
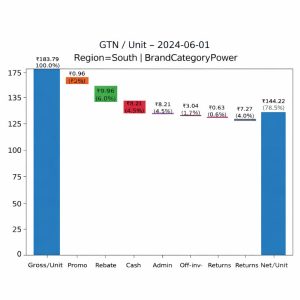
This Gross-to-Net waterfall shows how discounts, rebates, chargebacks, and returnserode gross sales to net revenue—pinpointing the biggest sources of marginleakage.
Capacity Planning
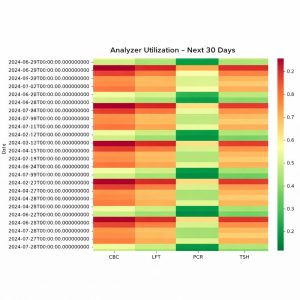
This heatmap shows day-wise analyzer utilization across key diagnostic tests,helping healthcare providers anticipate capacity constraints and optimize labscheduling.
PCR forecast
This PCR forecast projects test volumes over the next 30 days, helping healthcareproviders proactively plan analyzer capacity, staffing, and reagent availability.
Manufacturing
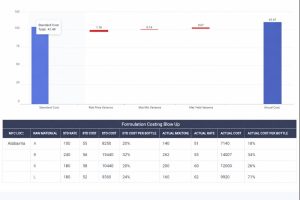
This manufacturing efficiency waterfall links standard-to-actual cost variances withformulation-level drivers, pinpointing where price, mix, and yield inefficiencies inflateproduction cost.
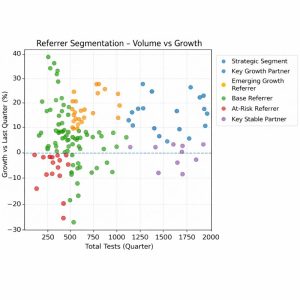
Product Affinities
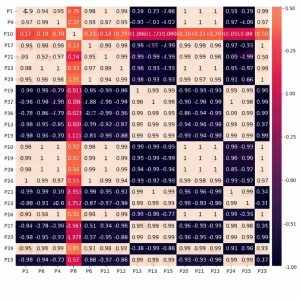
This heatmap reveals strong and weak product affinities based on co-purchasepatterns, enabling smarter bundling, cross-sell, and assortment decisions.
Profitability
Together, these charts reveal how price, volume, and margin mix shape bothrevenue and profitability—guiding smarter pricing and portfolio decisions.
Price Volume Mix
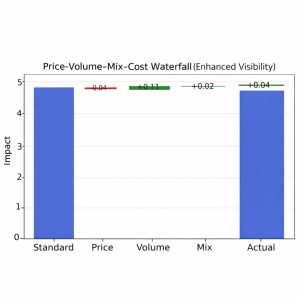
This waterfall quantifies how price, volume, mix & cost movements individuallycontribute to the overall performance change—pinpointing the true drivers behindperformance impact.
Predict Future
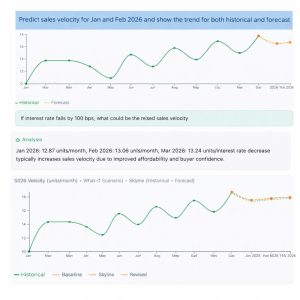
This chart lets users predict future sales velocity and instantly simulate what-if scenarios—such as interest rate changes—on the fly, all in one unified view.